I will build a custom admin dashboard with charts, roles and data tables
About this gig
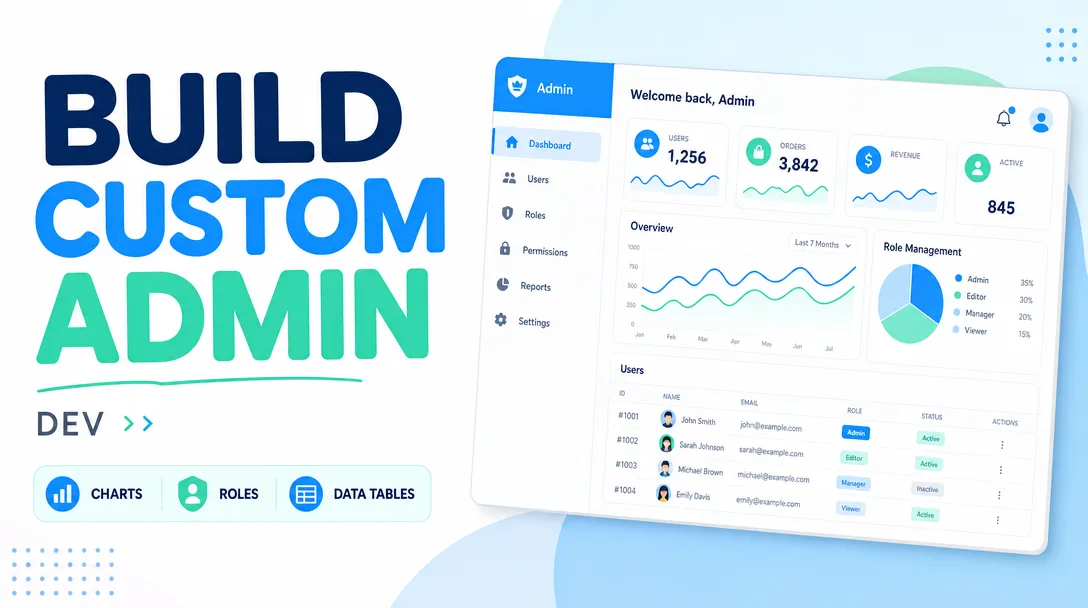
I will build a custom admin dashboard with interactive charts, role-based access, and sortable data tables, wired to your real data and ready to deploy.
What you get
- A responsive admin dashboard built as a single-page web app (React + TypeScript by default; Vue or plain JavaScript on request) with a clean, modern layout that works on desktop, tablet, and mobile.
- Interactive charts — line, bar, area, pie/donut, and stacked variants rendered with a proven library (Recharts, Chart.js, or ECharts). Tooltips, legends, date-range filtering, and responsive resizing included.
- Data tables with column sorting, text search, pagination (or infinite scroll), column show/hide, CSV export, and optional inline editing. Server-side pagination is supported for large datasets.
- Role-based access control (RBAC) — at minimum Admin and Viewer roles, with route guards and conditional UI so each role only sees the screens and actions it is permitted to use. Custom roles and granular permissions available in higher tiers.
- A login/auth flow integrated with your provider of choice (email + password, JWT, OAuth, Auth0, Clerk, Supabase Auth, or Firebase), including protected routes and session handling.
- Reusable summary cards / KPI widgets (totals, trends, percentage change) for the top of the dashboard.
- API integration: I connect the dashboard to your existing REST or GraphQL endpoints, or build a lightweight mock/demo API if your backend is not ready yet.
- A consistent design system — typography, spacing, color tokens, dark mode (Standard and up), and accessible components.
- Clean, commented, version-controlled source code delivered via a Git repository, plus a short README covering setup, environment variables, and how to add new pages.
- A walkthrough recording or live call so you and your team know exactly how everything fits together.
Plans
| Feature | Basic | Standard | Premium |
|---|---|---|---|
| Dashboard pages / screens | Up to 3 | Up to 6 | Up to 12 |
| Chart types | 2 | 4 | Unlimited |
| Data tables | 1 (client-side) | Up to 3 (sort + search + paginate) | Unlimited (server-side + inline edit) |
| Role-based access | 2 roles (Admin/Viewer) | 3 roles | Custom roles + granular permissions |
| Authentication | Basic login wiring | Full auth provider integration | SSO / OAuth + password reset |
| API integration | Mock/demo data | Connect to your REST/GraphQL API | Multi-source + caching layer |
| Dark mode | — | Included | Included |
| Responsive design | Included | Included | Included |
| Deployment help | — | Guided deploy | Full deploy + CI/CD setup |
| Revisions | 1 | 3 | Unlimited (within scope) |
| Source code + README | Included | Included | Included |
How it works
- Discovery — You share what the dashboard needs to show, who will use it, and any data sources, designs, or brand assets you already have. I send back a short scope summary and a small list of clarifying questions so we agree on screens, roles, and data before any code is written.
- Plan & data model — I map out the pages, the metrics for each chart, the table columns, and the permission matrix for each role. If you have an API, I review its shape; if not, I define a mock contract we can later swap for the real thing.
- Build the foundation — I scaffold the project, set up routing, the layout shell (sidebar, top bar, content area), the design tokens, and the auth/role guards.
- Charts, tables, and screens — I implement each dashboard page: KPI cards, charts wired to your data, and the interactive data tables with sorting, search, and pagination.
- Wire up data & roles — I connect real endpoints, handle loading/empty/error states, and verify that each role sees exactly what it should.
- Review & revisions — You get a live preview link. We walk through it, you send feedback, and I apply revisions within the agreed scope.
- Handover — I deliver the Git repository, a README, environment-variable docs, and a walkthrough so your team can run, deploy, and extend it.
Why choose this
I focus specifically on internal tools and admin panels, so I know the patterns that matter: predictable navigation, fast tables that do not choke on thousands of rows, charts that stay readable, and permission logic that genuinely prevents the wrong person from doing the wrong thing. The code is typed, componentized, and documented — not a tangle you will be afraid to touch later. I handle loading, empty, and error states properly, because real dashboards live or die on the messy edge cases, not the happy path. You get honest scoping up front: if something is bigger than a tier allows, I tell you before we start rather than halfway through.
Who it's for / use cases
- SaaS founders who need an internal admin panel to manage users, subscriptions, and metrics.
- Operations and analytics teams who want one screen for KPIs instead of juggling spreadsheets.
- Agencies and consultants needing a white-label client-facing reporting dashboard.
- E-commerce stores wanting an orders, inventory, and revenue overview with role separation for staff.
- Startups replacing a clunky no-code dashboard with something fast, branded, and extensible.
- Teams that need role-gated access so support, managers, and admins each see an appropriate view.
FAQ
Q: Do I need to have a backend or API ready before we start? No. If your API is ready, I connect to it directly. If it is not, I build the dashboard against realistic mock data using an agreed contract, so the real endpoints can be plugged in later with minimal rework.
Q: Can you match my brand colors and existing design? Yes. Share your logo, color palette, and any Figma or screenshots, and I will build the design tokens around them. If you have no design, I use a clean, modern default that you can adjust.
Q: Which technologies do you use? React + TypeScript by default, with a charting library such as Recharts, Chart.js, or ECharts, and a component approach suited to your stack. I can also work in Vue or plain JavaScript on request. Auth integrations include JWT, OAuth, Auth0, Clerk, Supabase, and Firebase.
Q: How do roles and permissions actually work? Each role maps to a set of allowed routes and actions. The dashboard hides or disables what a role cannot use, and route guards block direct URL access. Premium adds custom roles and fine-grained, per-feature permissions.
Q: Can the tables handle large amounts of data? Yes. For big datasets I use server-side pagination, sorting, and search so the browser only loads what it needs, keeping the interface fast even with many thousands of records.
Q: Will I be able to add new pages myself afterward? Yes. The project is structured with reusable layout, chart, and table components, and the README explains how to add a new page or widget. The code is yours to extend.
Q: Do you help with deployment? Standard includes guided deployment to a host such as Vercel, Netlify, or your own server. Premium includes full deployment plus a basic CI/CD pipeline so future updates ship automatically.
Q: What do you need from me to get started? A description of the screens and metrics you want, your data source or API details (if available), any branding assets, and the list of roles. The clearer this is, the faster and more accurate the build.
Reviews★4.6(9)
- @thedesignhub★★★★★5
The charts update with our actual data and look professional. Couldn't be happier with how the whole panel turned out.
- @ria_h★★★★★3
The dashboard works and the roles do their job, but a few of the chart labels needed fixing after delivery and it took some back and forth to sort out.
- @miax★★★★★5
Loved that the data tables are sortable and searchable. Made managing our records so much easier.
- @liam_writes★★★★★5
He set up admin, editor and viewer permissions just like I asked, and each role only sees what it should. Really clean implementation.
- @finn_pro★★★★★5
The admin dashboard came out exactly how I pictured it, with clean charts and the role-based logins working perfectly for my team. Super happy with it.
- @amir_fx★★★★★5
Honestly impressed. The whole thing has the charts, the permission levels, and filterable tables all wired together and it just works.
- @mason_io★★★★★4
Good dashboard overall. The tables with pagination handle our large dataset well, though I wish communication had been a bit faster during the build.
- @thedevco★★★★★4
Solid work on the dashboard and the user roles. Took a couple of rounds of revisions to get the chart colors right, but the end result is great.
- @alexg★★★★★5
Quick delivery and the data tables with the analytics charts are exactly what our internal team needed. Will be back for more.