I will design a live Excel dashboard with pivot tables and charts
About this gig
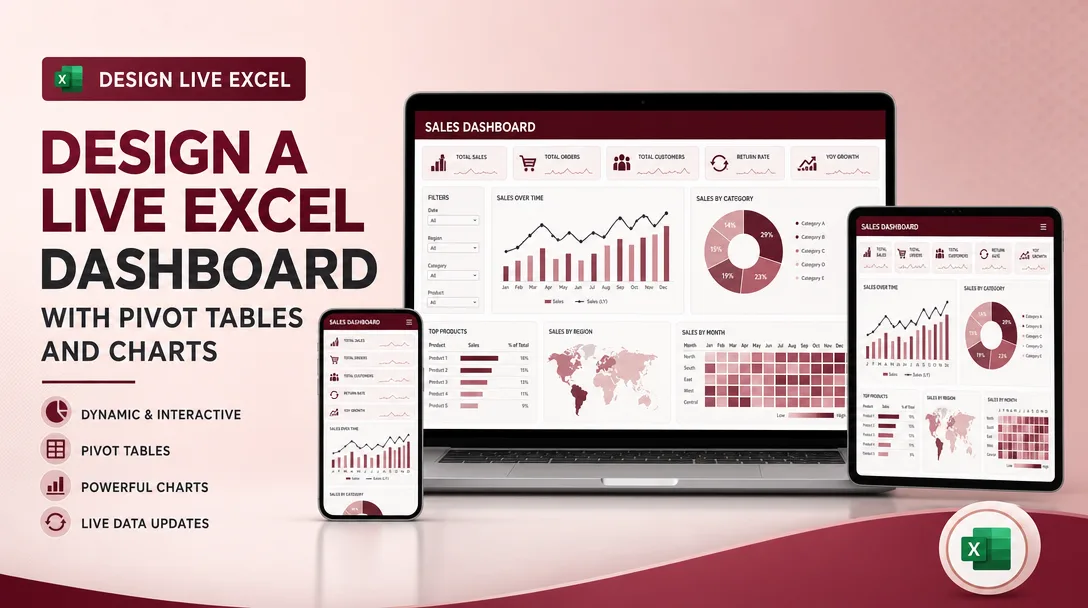
I will design a live Excel dashboard that turns your raw spreadsheets into pivot tables, dynamic charts, and one clean control panel that refreshes the moment your data changes.
If you are tired of rebuilding the same report every week, copy-pasting numbers, and squinting at a wall of rows, this service hands you a single Excel file you can actually run your decisions from.
What you get
- A polished, interactive dashboard sheet built natively in Microsoft Excel (.xlsx), designed to read top-to-bottom like a real report, not a maze of tabs.
- One or more pivot tables structured around the questions you actually ask: totals by month, by region, by product, by rep, by category, by status, or whatever dimensions matter to your data.
- Dynamic charts wired to the pivots, column, bar, line, stacked, combo, or a clustered comparison, so visuals update automatically when the underlying data updates.
- KPI cards / headline tiles for your most important numbers (revenue, units, conversion, average, count, growth percentage) placed at the top where decisions get made.
- Interactive controls, slicers and timeline filters, so you (or your team) can click to filter by date range, segment, or category without touching a single formula.
- A clean data layer: your source data organized into a proper Excel Table so new rows are picked up automatically on refresh.
- Helper formulas where useful (SUMIFS, COUNTIFS, INDEX/MATCH or XLOOKUP, IF logic, percentage and variance calculations) documented so you understand what each cell does.
- Consistent visual design: a tidy color palette, readable fonts, number formatting (thousands separators, currency symbols, percentages, conditional formatting / data bars), and aligned layout.
- A short how-to note (written instructions, or a quick walkthrough video on higher tiers) explaining how to refresh, how to add new data, and how the filters work.
- The fully editable working file, no locked black boxes, no add-ins you have to buy, no macros you cannot read unless you specifically request automation.
Plans
| Feature | Basic | Standard | Premium |
|---|---|---|---|
| Dashboard sheets | 1 | 1 | Up to 3 |
| Pivot tables | Up to 2 | Up to 5 | Up to 10+ |
| Charts / visuals | Up to 3 | Up to 6 | Up to 12+ |
| Slicers & timeline filters | Basic | Yes | Advanced multi-filter |
| KPI summary cards | Included | Included | Expanded |
| Conditional formatting | Basic | Yes | Advanced |
| Data cleanup of source | Light | Standard | Thorough |
| How-to instructions | Written | Written | Written + video walkthrough |
| Revisions | 1 | 2 | 3 |
| Editable source file | Yes | Yes | Yes |
How it works
- You share your data and goal. Send me your Excel file or CSV (or a representative sample), and tell me the key questions the dashboard should answer and who will use it.
- I review and confirm scope. I check your column structure and data quality, flag anything messy or inconsistent, and confirm the metrics, dimensions, and chart types before building.
- I prepare the data layer. I shape your source into a clean Excel Table, fix obvious formatting issues, and set things up so future rows refresh automatically.
- I build the pivots and visuals. I create the pivot tables, wire the charts to them, add slicers/timeline filters, lay out the KPI cards, and apply the visual design.
- I deliver a draft for your review. You open it, click around, and tell me what to adjust, wording, ordering, colors, an extra breakdown, a different chart.
- I revise and finalize. I apply your revisions within your plan, then send the final .xlsx plus the how-to note (and walkthrough video on Premium).
Why choose this
This is a real, native Excel build, not a screenshot, not a template you have to reverse-engineer, and not a tool that locks you into a subscription. Everything is built with standard Excel features (pivot tables, slicers, Tables, charts, formulas) so it keeps working on any modern desktop version of Excel and stays fully editable by you and your team.
I focus on dashboards that are genuinely live: once it is built, you paste or add new data, hit refresh, and every pivot, chart, and KPI updates together. No re-doing the report from scratch each cycle. I also care about clarity, the layout is designed so the person reading it can find the headline numbers in seconds and drill into detail only when they want to.
You get an honest collaborator. If your data has problems that will undermine the dashboard (duplicate records, inconsistent category names, dates stored as text), I will tell you plainly and either fix what is in scope or explain what needs cleaning first.
Who it's for / use cases
- Small business owners who want a single screen for sales, expenses, and profit by month.
- Sales and marketing teams tracking pipeline, leads, conversion rates, and performance by rep or channel.
- Operations and inventory managers watching stock levels, order volume, fulfillment status, and supplier breakdowns.
- Finance and bookkeeping needing budget-vs-actual, cash flow, and category spend summaries.
- Project managers monitoring task status, hours, and completion across teams.
- Students, analysts, and researchers who need survey results or experiment data summarized into clear visuals.
- Anyone drowning in a giant spreadsheet who just wants the answers pulled to the top.
FAQ
Q: What version of Excel do I need? Microsoft Excel 2016 or newer on Windows or Mac works best, and Microsoft 365 is ideal. Pivot tables and slicers also display in recent versions, but I recommend the desktop app for the smoothest refresh experience. Excel for the web has limited pivot/slicer support, so I will note any caveats if that is your environment.
Q: Will the dashboard really update by itself? Yes, within reason. When you add new rows to the source data and refresh (Data, Refresh All), the pivots and charts update automatically because they are connected to a structured Table. It is one click, not a rebuild.
Q: What format should I send my data in? An .xlsx or .csv file is perfect. The cleaner and more consistent your columns and headers are, the better the result, but I can work with messy data and will tell you what I cleaned up.
Q: Can you handle confidential or sensitive data? Yes. If you prefer, send me a sample or anonymized version with the same structure, and I will build against that. I treat your files as private and can delete them after delivery on request.
Q: Do you use macros, VBA, or Power Query? The standard build uses pivot tables, formulas, and charts, no macros required, so the file is safe and portable. If you want Power Query automation or a VBA refresh button, mention it up front so I can confirm it fits the scope.
Q: How many charts and pivots can I get? It depends on your plan, see the Plans table above. If your needs fall between tiers or you need an unusually large number of visuals, message me first and I will recommend the right fit.
Q: What if I need changes after delivery? Each plan includes a set number of revisions to refine the dashboard you ordered. If you later want new metrics, extra sheets, or a redesign beyond the original scope, that can be arranged as additional work.
Q: Can you connect it to a database or live external feed? This service covers dashboards built on Excel/CSV data that you refresh. Direct live connections to external databases or APIs are outside the standard scope, but message me with details and I will let you know what is feasible.
Reviews★4.8(4)
- @finn_writes★★★★★5
Sent over a messy export of our retail sales data and got back a clean dashboard with pivot tables broken down by store and month, plus slicers I can click to filter on the fly. The charts update automatically when I paste in new numbers, which is exactly the live setup I needed. Turnaround was under two days.
- @noracodes★★★★★5
Built me a KPI dashboard for our small logistics company tracking deliveries and costs. Super responsive over chat and walked me through how the pivot tables refresh.
- @irisj★★★★★5
I run a freelance bookkeeping practice and needed a reusable monthly P&L dashboard for clients. The conditional formatting and the chart breakdowns by category came out cleaner than I expected, and it genuinely updates the moment I drop in fresh figures.
- @kailabs★★★★★4
Solid work on the inventory dashboard. The pivots and bar charts look great and everything links to the source tab properly. Took one revision to get the date grouping the way I wanted, but they fixed it quickly and were patient about it.