I will do exploratory data analysis and statistical reports in Python
About this gig
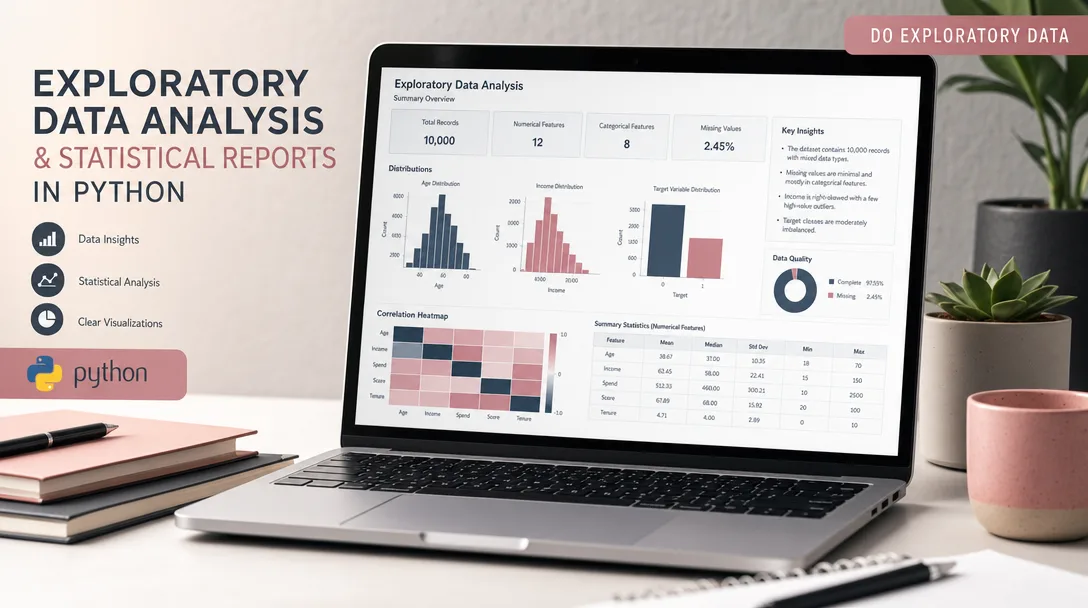
I will do exploratory data analysis and statistical reports in Python, turning your raw spreadsheets or database exports into clear, decision-ready insight you can actually act on.
If you have data but no clarity, I help you understand what is really going on inside it: the patterns, the outliers, the relationships, and the statistical signals that matter for your decisions. I deliver a clean, documented exploratory data analysis (EDA) and a structured statistical report in Python, written so that both technical and non-technical stakeholders can follow the reasoning and trust the conclusions.
What you get
- A fully documented Python analysis built with pandas, NumPy, and the scientific stack (matplotlib, seaborn, and SciPy/statsmodels where appropriate).
- A data quality audit: missing-value mapping, duplicate detection, type inconsistencies, impossible or out-of-range values, and recommended fixes.
- Descriptive statistics for every relevant variable: counts, means, medians, standard deviations, ranges, quartiles, and distribution shape (skew and kurtosis).
- Univariate analysis with histograms, box plots, and density plots to show how each variable behaves on its own.
- Bivariate and multivariate analysis: correlation matrices, scatter plots, grouped comparisons, and cross-tabulations to reveal how variables move together.
- Outlier and anomaly detection using IQR, z-scores, or distribution-aware methods, with a plain-language note on whether each one is an error or a genuine signal.
- Statistical testing where your questions call for it: t-tests, ANOVA, chi-square tests of independence, correlation significance, and effect sizes, with assumptions checked and stated.
- A clean set of publication-quality charts (PNG/SVG) with readable labels, titles, and consistent styling.
- A written report (PDF or formatted document) summarizing methods, findings, caveats, and concrete recommendations in non-technical English.
- The full reproducible code as a commented Jupyter notebook and/or
.pyscript, so you or your team can rerun the analysis on new data.
Plans
| Feature | Basic | Standard | Premium |
|---|---|---|---|
| Dataset size | Up to ~10k rows, single file | Up to ~250k rows, multiple files | Large / multi-source, joined data |
| Data cleaning & quality audit | Light | Full | Full + documented pipeline |
| Descriptive statistics | Yes | Yes | Yes |
| Visualizations | Core set (up to 8) | Extended set (up to 20) | Comprehensive, custom-styled |
| Correlation & relationship analysis | Basic | Yes | Yes, in depth |
| Statistical hypothesis tests | — | Up to 3 tests | Tailored test suite |
| Written report | Summary notes | Structured PDF report | Full report + recommendations |
| Reproducible notebook / script | Yes | Yes | Yes, parameterized |
| Revisions | 1 | 2 | 3 |
| Live walkthrough call | — | Optional | Included |
How it works
- You share the data and the questions. Send me your dataset (CSV, Excel, JSON, Parquet, or a database export) along with what you want to learn. Even a rough list of questions helps me focus the analysis on what matters to you.
- I review and scope. I inspect the structure, confirm what is feasible, flag anything missing or ambiguous, and agree the deliverables and tier with you before starting.
- I clean and audit. I profile the data, document quality issues, and apply transparent cleaning steps so every later result rests on a sound foundation.
- I explore. I run descriptive statistics, build visualizations, and investigate distributions, relationships, and outliers, following the threads the data reveals.
- I test and validate. Where your questions are about differences, associations, or significance, I run the appropriate statistical tests, check their assumptions, and report effect sizes alongside p-values.
- I report and hand off. You receive the report, the charts, and the reproducible code, plus a short summary of the key takeaways. We then refine through the revisions included in your tier.
Why choose this
I treat exploratory analysis as detective work, not a button-press. I do not just dump a default profiling report on you and call it done. Every chart and every test is chosen to answer a real question, and every conclusion comes with its caveats stated honestly, including sample-size limits, confounders, and where correlation should not be read as causation.
The work is fully reproducible. You get clean, commented code, so the analysis is auditable and rerunnable rather than a black box. And the report is written in clear English, so the people making decisions can understand the "so what," not just the numbers.
Who it's for / use cases
- Founders and product teams who have usage, sales, or survey data and want to know what it is telling them.
- Researchers and students who need rigorous EDA, descriptive statistics, and hypothesis testing for a project, thesis, or paper.
- Marketing and operations teams comparing groups, channels, cohorts, or time periods.
- Analysts who need a second pair of hands to clean, explore, and document a dataset before modeling.
- Anyone preparing data for a dashboard, a pitch, or a board deck who wants the underlying analysis done properly first.
Common use cases include customer and churn analysis, A/B test evaluation, survey result breakdowns, sales and revenue trend exploration, sensor or log data profiling, and pre-modeling feature exploration.
FAQ
Q: What file formats do you accept? CSV, Excel (XLSX/XLS), JSON, Parquet, TSV, and SQL/database exports. If your data lives somewhere else, message me first and we will sort out the cleanest way to share it.
Q: Will you build a predictive or machine learning model? This service focuses on exploratory analysis and statistical reporting, which is often the right groundwork before modeling. If you also want a predictive model, mention it up front and we can scope that as additional work.
Q: How do you handle confidential or sensitive data? I treat all data as confidential and only use it for your project. I am happy to work with anonymized or sampled data, and I can sign an NDA on request before you send anything.
Q: Can you guarantee a specific result, like "prove X causes Y"? No, and I would be wary of anyone who does. I report what the data actually supports, with honest limitations. Observational data can show associations, but it rarely proves causation on its own.
Q: What if my data is messy or incomplete? That is normal and expected. Cleaning and a quality audit are part of the work. I will document every issue I find and the choices I make, and I will tell you if missing data limits what can be concluded.
Q: Will I be able to rerun the analysis myself? Yes. You receive the commented Jupyter notebook and/or Python script, so you or your team can rerun it on updated data with minimal changes.
Q: How long does it take? It depends on dataset size and the number of questions. Smaller Basic projects typically turn around quickly, while Premium multi-source work takes longer. I will confirm a realistic timeline before we begin.
Q: What do you need from me to start? The dataset, a short description of what each column means, and the key questions or decisions you want the analysis to inform. The clearer the questions, the sharper the report.
Reviews★4.8(4)
- @thepixelco★★★★★4
Solid EDA report on my clinical trial dataset with proper hypothesis testing and confidence intervals. Took one revision to get the segmentation grouped the way I wanted, but he was responsive and the final pandas notebook is well commented.
- @themakers★★★★★5
Brilliant work on our SaaS churn analysis. The regression output and the seaborn visualizations made it obvious which features were driving cancellations, and everything was reproducible from the scripts he handed over.
- @lunarbyte★★★★★5
Sent over a messy CSV of two years of Shopify order data and got back a clean Jupyter notebook with distribution plots, correlation heatmaps, and a written summary of the retention trends. The statistical breakdown of repeat-purchase rates was exactly what I needed for my investor deck.
- @mayae★★★★★5
Fast turnaround, under three days, and the communication was great the whole way through. He flagged a couple of outliers in my survey responses that I hadn't even noticed and explained the t-tests in plain English.