I will create a Google Looker Studio marketing analytics dashboard
About this gig
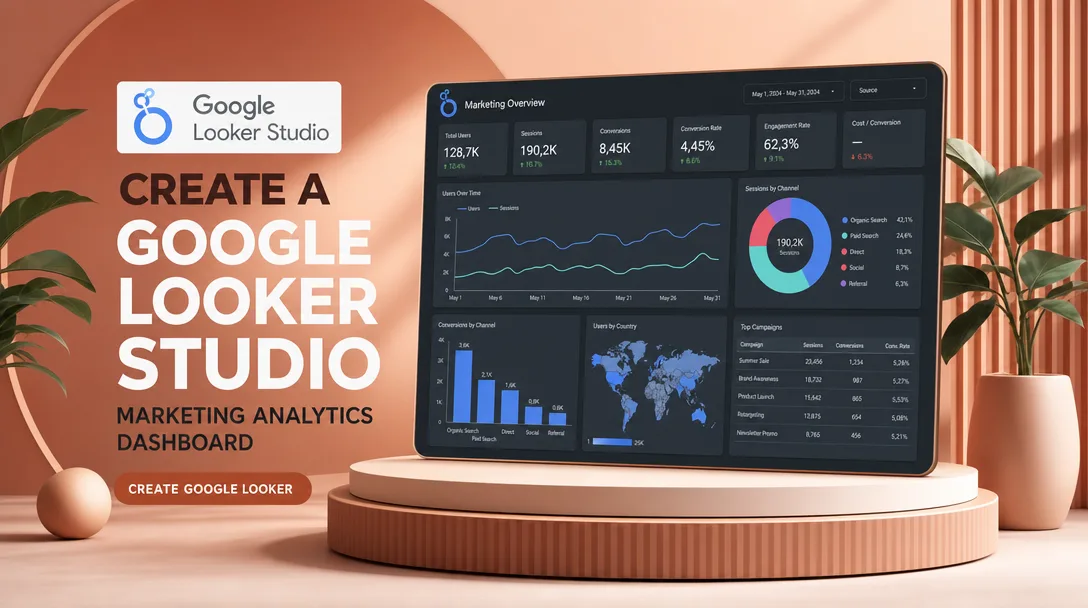
I will create a Google Looker Studio marketing analytics dashboard that connects your real data sources and turns scattered metrics into one clear, decision-ready report you can refresh with a click.
If your marketing numbers live in five different tabs and nobody trusts the totals, I will fix that. I build clean, fast, properly modeled dashboards in Looker Studio (formerly Google Data Studio) that show exactly how your channels, campaigns, and spend are performing.
What you get
- A fully built Looker Studio dashboard tailored to your marketing goals, not a generic template dropped on your account.
- Live connections to your actual data sources: Google Analytics 4, Google Ads, Search Console, Meta Ads (Facebook/Instagram), Google Sheets, BigQuery, and most platforms reachable through native or partner connectors.
- A clear multi-page structure, typically an executive overview plus per-channel detail pages (paid, organic, social, email), so each audience sees the view that matters to them.
- Core marketing KPIs done right: sessions, users, conversions, conversion rate, cost, CPC, CPM, CTR, CPA/CPL, ROAS, revenue, and channel/source-medium breakdowns.
- Interactive controls so stakeholders can self-serve: date-range pickers, period-over-period comparison, and filters for channel, campaign, device, country, or landing page.
- Blended data where it makes sense (for example combining ad spend from multiple platforms against GA4 conversions) using calculated fields and data blending.
- Clean, on-brand design: your logo, colors, and fonts, with readable scorecards, time-series, tables, and geo or funnel visuals chosen for clarity over decoration.
- A short walkthrough (Loom video or a live call) plus a one-page guide explaining what each metric means and how to read the report.
- Editable ownership: the dashboard lives in your Google account, so you keep full control after delivery.
Plans
| Feature | Basic | Standard | Premium |
|---|---|---|---|
| Dashboard pages | 1 page | Up to 3 pages | Up to 6 pages |
| Data sources connected | 1 source | Up to 3 sources | Up to 6+ sources |
| Core KPI scorecards & charts | Yes | Yes | Yes |
| Date range & comparison controls | Yes | Yes | Yes |
| Interactive filters | Basic | Multiple | Advanced + drill-down |
| Calculated fields / custom metrics | — | Included | Advanced |
| Data blending across platforms | — | Limited | Full multi-source blends |
| Branding (logo, colors, fonts) | Logo only | Full | Full + custom layout |
| Walkthrough | Written notes | Loom video | Live call + Loom |
| Revisions | 1 | 2 | 3 |
| Delivery speed | Standard | Faster | Priority |
How it works
- You place your order and share a short brief: your goals, the channels you run, the platforms you use, and the KPIs your team actually cares about.
- We confirm scope and you grant me viewer access to the relevant accounts (GA4, Google Ads, Search Console, ad platforms, or a prepared Google Sheet/BigQuery dataset).
- I audit your data sources, check that tracking and conversions are firing sensibly, and flag any gaps before building so the dashboard reflects reality.
- I design the structure and metric definitions, then confirm them with you so we agree on what each number means.
- I build the dashboard: connect sources, create calculated fields, set up blends, add charts and controls, and apply your branding.
- I deliver a draft for review, walk you through it, and apply your revisions within the plan's limit.
- You receive the finished dashboard in your own Google account, with edit rights and a guide so you can refresh and extend it yourself.
Why choose this
I focus on accuracy first and visuals second. A pretty dashboard that reports the wrong conversion count is worse than no dashboard, so I validate metric definitions against your source platforms before I make anything look good. I keep the build performant by limiting heavy queries, using sensible data ranges, and structuring blends so the report loads quickly instead of spinning. Everything is documented in plain language, which means your team can read the numbers without needing me on call, and you own the asset outright. I also keep scope honest: if something you want is not technically possible with Looker Studio or your current connectors, I will tell you upfront and suggest a realistic alternative rather than overpromising.
Who it's for / use cases
- Small businesses and ecommerce stores that want one trusted view of traffic, spend, and revenue instead of logging into five platforms.
- Marketing agencies that need clean, branded client reporting they can hand off or white-label.
- In-house marketers preparing weekly or monthly performance reviews for leadership.
- Founders who want a simple executive snapshot of acquisition, cost, and ROAS.
- Teams migrating off manual spreadsheet reports who want automatic, always-current dashboards.
- Anyone running paid campaigns who needs to compare channels on cost per result and return on ad spend side by side.
FAQ
Q: Which data sources can you connect? I work with GA4, Google Ads, Search Console, Meta Ads, Google Sheets, BigQuery, YouTube, and many other platforms available through native or reputable partner connectors. Tell me your stack and I will confirm what is supported before you order.
Q: Do I need to give you my passwords? No. I only need viewer or read access granted through each platform's normal sharing settings, or a prepared Google Sheet/BigQuery dataset. You never share passwords, and you can revoke access at any time.
Q: Will the dashboard update automatically? Yes. It connects directly to your live sources, so the data refreshes on Looker Studio's normal cadence. You see current numbers whenever you open it, with no manual exports.
Q: What if my tracking or conversions are not set up correctly? I will flag any issues I spot during the data audit. Fixing the underlying tracking (for example GA4 tagging or conversion setup) is a separate task, but I will tell you clearly what needs attention so the dashboard reflects accurate data.
Q: Can you match my brand and colors? Yes. I apply your logo, brand colors, and fonts so the report looks like it belongs to your company. Premium includes custom layout work for a more polished, presentation-ready feel.
Q: Who owns the dashboard after delivery? You do. It is built in your own Google account with full edit rights, so you can keep using, refreshing, and extending it long after the project ends.
Q: How many revisions are included? Basic includes one revision round, Standard two, and Premium three. Revisions cover adjustments to the metrics, layout, and visuals we agreed on in the brief.
Q: Can you add new pages or metrics later? Absolutely. Once the foundation is built, extending it is straightforward, and you can reach out for additional pages, sources, or custom views whenever your reporting needs grow.
Reviews★4.6(7)
- @jackq★★★★★5
Turned a messy spreadsheet of monthly client reports into a clean, branded Looker Studio template I can now reuse for every agency client. The page that compares spend vs conversions per platform is a lifesaver during review calls.
- @lab92★★★★★5
As a local real estate marketer I wanted lead-source tracking that my clients could actually understand, and that's exactly what I got. The blended data sources and the auto-updating month-over-month comparison are gold. Will be ordering again for my other accounts.
- @kailabs★★★★★4
Solid dashboard that blends my Shopify sales with my email marketing metrics. Took a little back-and-forth to get the channel attribution grouped the way I wanted, but they were patient and made every revision. Happy with where it landed.
- @mayaj★★★★★5
Fast turnaround and clear communication.
- @finn_writes★★★★★5
Connected our Google Ads and GA4 data into one Looker Studio dashboard for our e-commerce store and it finally gives me a single view of ROAS and CAC by campaign. Delivered in three days and the date-range filters work perfectly.
- @noracodes★★★★★5
I run a small SaaS and needed something to track signups against our paid social spend. The dashboard pulls from Meta and Google in real time and the funnel breakdown is exactly what I asked for. Super responsive over messages whenever I had a question.
- @lunarcraft★★★★★3
The dashboard itself looks good and the GA4 traffic and conversion charts are accurate. I did have to follow up a couple of times because two of my custom UTM filters weren't initially connecting correctly, but they did fix it in the end.