I will build an interactive Power BI dashboard with KPIs and DAX measures
About this gig
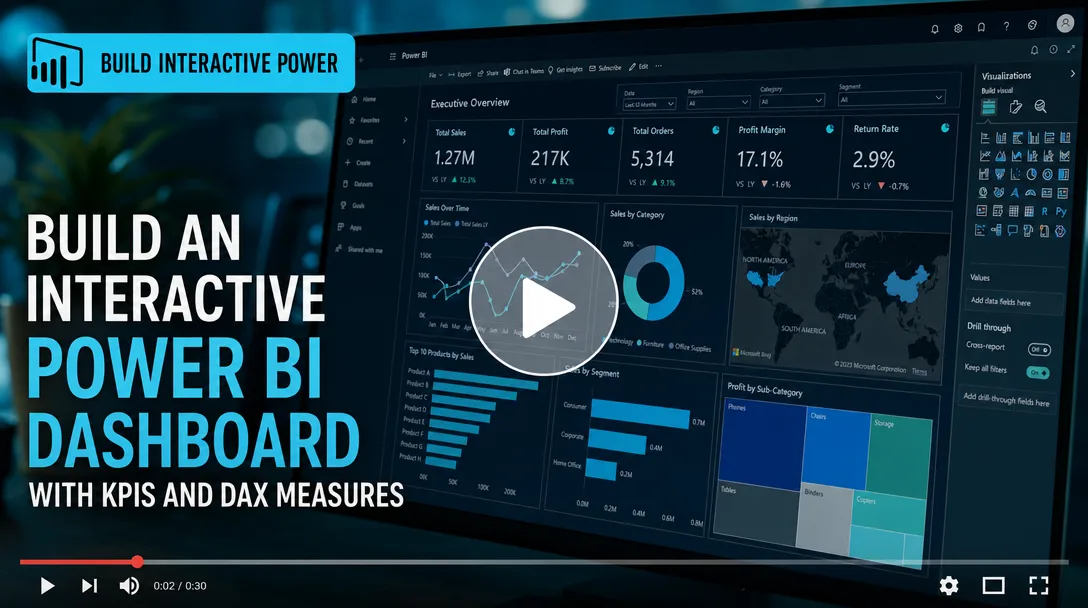
I will build an interactive Power BI dashboard with clean DAX measures, drill-through pages, and KPIs that turn your raw data into decisions you can act on today.
What you get
Every project is built around the questions you actually need answered, not a generic template. Concrete deliverables include:
- A fully interactive Power BI report (
.pbixfile) you own outright, plus an optional published version to your Power BI Service workspace. - A clean, documented data model with properly defined relationships, a dedicated date table, and a star-schema layout where your sources allow it.
- DAX measures written from scratch: running totals, year-over-year and month-over-month growth, moving averages, rolling 12-month figures, ratios, rankings, and "% of total" calculations.
- KPI cards and indicators with conditional formatting, target-vs-actual comparisons, and trend sparklines so status is readable at a glance.
- Slicers and filters for date ranges, regions, products, segments, or any dimension in your data, with sync across pages where it helps.
- Drill-through and drill-down navigation so a viewer can click a summary metric and land on the detailed records behind it.
- Tooltips and bookmarks for guided storytelling, plus buttons for page navigation and reset-filter actions.
- A consistent visual theme matched to your brand colors, with a custom JSON theme file applied across all visuals.
- A short handover document explaining the model, the key measures, and how to refresh the data yourself.
You also get the underlying Power Query (M) transformation steps cleanly named and grouped, so future edits are straightforward whether I do them or your team does.
Plans
| Feature | Basic | Standard | Premium |
|---|---|---|---|
| Report pages | 1 page | Up to 3 pages | Up to 6 pages |
| Data sources connected | 1 | Up to 3 | Up to 6 |
| KPI cards & visuals | Core set | Expanded set | Full set + custom visuals |
| DAX measures | Up to 8 | Up to 20 | Up to 40+ |
| Power Query data cleaning | Basic | Standard | Advanced (multi-source merge) |
| Drill-through / drill-down | — | Included | Included |
| Bookmarks & navigation | — | Included | Included |
| Custom brand theme | — | Included | Included |
| Scheduled refresh setup | — | — | Included |
| Handover document | Brief notes | Included | Detailed + walkthrough video |
| Revisions | 1 | 2 | 3 |
If your needs sit between tiers, tell me and I'll scope a fair custom offer before any work begins.
How it works
- Discovery. You share the business questions you want answered and the decisions the dashboard should support. We agree on the metrics that matter and who the audience is.
- Data review. You send sample data (Excel, CSV, SQL extract, or a live connection). I assess structure, quality, and what cleaning is required, then confirm scope.
- Modeling. I shape the data in Power Query, build the relationships, add a proper date table, and write the DAX measures your KPIs depend on.
- Design. I lay out the pages, build the visuals, apply your theme, and wire up slicers, drill-through, and navigation.
- Review. You receive a working draft. We walk through it, and you flag anything to adjust within your plan's revision count.
- Handover. I deliver the final
.pbix, publish to your workspace if requested, set up refresh, and provide documentation so you're never locked in.
Why choose this
I focus on dashboards that get used, not ones that look impressive in a screenshot and then gather dust. That means the numbers are correct first: I validate every measure against your source totals so a figure on the dashboard always reconciles with what your finance or operations team already trusts. It means the model is built to scale, so adding next quarter's data is a refresh and not a rebuild. And it means the layout respects how people actually read a report, with the headline KPIs up top, supporting detail below, and a clear path to drill into anything that looks off.
I write DAX that is readable and commented rather than copy-pasted black boxes, so whoever maintains the report after me can understand it. I keep communication clear, share progress drafts early, and don't disappear between milestones.
Who it's for / use cases
This service fits founders, analysts, operations leads, and managers who have data sitting in spreadsheets or a database and need it turned into something they can monitor weekly. Common use cases:
- Sales dashboards tracking pipeline, win rates, quota attainment, and rep performance.
- Finance dashboards for revenue, margin, budget-vs-actual, and cash-flow trends.
- Marketing dashboards covering campaign ROI, channel attribution, and funnel conversion.
- Operations and supply-chain dashboards for inventory, fulfillment times, and SLA tracking.
- HR and people analytics for headcount, attrition, and hiring-funnel metrics.
- Executive summaries that roll several departments into one board-ready view.
If you have raw data and a recurring question like "how are we doing this month?", this is built for you.
FAQ
Q: What data sources can you connect to? Excel, CSV, Google Sheets, SQL Server, PostgreSQL, MySQL, SharePoint, and most common databases or APIs supported natively by Power BI. Tell me your source up front and I'll confirm compatibility before we start.
Q: Do I need a Power BI license? You can build and view reports for free in Power BI Desktop. To publish, share, or schedule automatic refresh in the Power BI Service, you or your organization will need the appropriate Microsoft licensing. I'll guide you, but the license itself is on your side.
Q: Will the dashboard refresh automatically? Yes, with the Premium plan I configure scheduled refresh where your data source and licensing support it. For file-based sources I'll set up the refresh path and explain any gateway requirements.
Q: How do I send my data securely? You can share via your preferred secure link, or provide anonymized or sample data for the build and connect the live source yourself at the end. I'm happy to work under an NDA.
Q: What if my data is messy? That's normal and expected. Cleaning and reshaping in Power Query is part of every plan; heavier multi-source merging and deduplication is covered under Standard and Premium.
Q: Can you replicate a specific dashboard design I've seen? In most cases, yes. Share a reference or sketch and I'll match the layout and interactions as closely as Power BI's capabilities allow.
Q: What do you need from me to start? A clear list of the metrics and questions that matter, a sample of your data, and your brand colors if you'd like a custom theme. The more context on how the report will be used, the better the result.
Q: What happens after delivery if I need changes? Each plan includes a set number of revisions during the project. Beyond that, I'm available for ongoing updates and new pages as a separate engagement, so the dashboard can grow with you.
Reviews★4.6(9)
- @miax★★★★★4
Solid Power BI work for our marketing data. The funnel visuals and conversion-rate DAX are great. Took one extra round of revisions to get the date hierarchy filtering the way I wanted, but he was patient and fixed it.
- @finn_design★★★★★3
The dashboard works and the KPIs are correct, but the initial design felt a little cluttered for our healthcare data and needed a couple of revisions to simplify the layout. Got there in the end, just took longer than I expected.
- @amir_fx★★★★★5
I run a small e-commerce shop and needed to track sales and inventory in one place. The dashboard he built has drill-through pages and the YoY measures are spot on. Really happy.
- @works7★★★★★5
Turnaround was fast and the result looks professional. Loved the tooltips and bookmarks.
- @mintforge★★★★★5
Connected straight to our SQL source and built refreshable measures for daily active users and retention cohorts. Interactive, fast, and exactly what our startup needed for the investor deck.
- @thestudioco★★★★★4
Good dashboard for our HR headcount and attrition metrics. The visuals are clear and the measures are accurate. I'd have liked a bit more explanation on how the relationships were modeled, but overall a strong deliverable.
- @lucas_b★★★★★5
Built a financial dashboard with P&L, cash flow and budget-vs-actual measures. The time-intelligence DAX is clean and well documented so I can maintain it myself. Worth every minute.
- @sophia21★★★★★5
Excellent communication throughout. Asked smart questions about which KPIs actually mattered for our logistics ops before building anything, then delivered an interactive report with on-time delivery and cost-per-mile cards that the whole team now uses in our weekly review.
- @ria_h★★★★★5
Took our messy sales export and turned it into a clean Power BI dashboard with revenue, win-rate and pipeline KPIs. The DAX measures for month-over-month growth work perfectly and the slicers make it easy to filter by region. Delivered a day early.